Client Reporting by Email: Why Some Reports Get Read While Others Are Ignored
Agency professionals invest hours creating client reports that often go unread in overcrowded inboxes. With office workers receiving 120+ daily emails, even valuable reports struggle for attention. Understanding proven patterns and strategies can transform your client reporting from ignored background noise into engaging, decision-driving communication.



Every agency professional knows the sinking feeling: you've spent hours crafting a comprehensive client report, carefully analyzing metrics and preparing insights, only to send it into the void of an overcrowded inbox. Days pass with no response. No acknowledgment. No action on the critical decisions you flagged. The report you invested so much effort into has effectively been ignored, and you're left wondering what went wrong.
You're not alone in this frustration. The reality of modern email communication has created a perfect storm where even the most valuable client reports struggle to break through. The average office worker now receives between 117 and 121 emails per day, according to Mailbird's 2026 Email Productivity Guide, spending 5 to 15.5 hours weekly just managing their inbox. In this environment, your carefully prepared status update is competing with dozens of other messages for a few precious seconds of attention.
The gap between reports that get read and those that are ignored isn't random—it follows surprisingly consistent patterns backed by research from email marketing analytics, project management best practices, and behavioral studies on information overload. Understanding these patterns and implementing proven strategies can transform your client reporting from background noise into decision-driving communication that stakeholders actually engage with.
The Inbox Reality: Why Client Reports Disappear
Before we can solve the problem of ignored reports, we need to understand the environment they're entering. The modern inbox isn't just busy—it's fundamentally broken for thoughtful communication.
Information Overload Has Become the Norm
According to Harvard Business Review's research on information overload, 38 percent of employees believe they receive an "excessive" volume of communications at their organization, and only 13 percent say they received less information in 2022 than in 2021. This isn't a temporary spike—it's the new baseline for knowledge work.
The problem extends beyond sheer volume. Mailbird's productivity research reveals that knowledge workers toggle between applications more than 1,200 times per day, translating to roughly four hours of lost productive time weekly due to constant context switching. Every additional step required to access and interpret your report—opening an attachment, switching to a browser, logging into a dashboard—further reduces the likelihood of meaningful engagement.
In this environment, your client report isn't being evaluated on its merits alone. It's being filtered through overwhelmed attention, competing priorities, and a triage mentality where recipients are actively looking for reasons to defer or delete messages.
Mobile Reading Has Changed Everything
The way people consume email has fundamentally shifted, and many client reports haven't adapted. Campaign Monitor's email design research shows that approximately 63 percent of emails are now opened on mobile devices. This isn't just a technical detail—it's a fundamental constraint on how your content can be consumed.
A Litmus study on email engagement found that 61 percent of emails receive eight seconds or more of attention, 23 percent are skimmed, and 15 percent are merely glanced at. When your stakeholder is reviewing your report on a phone while standing in line for coffee, that dense paragraph explaining monthly performance metrics simply won't be read.
Campaign Monitor notes that adults' average attention span is around eight seconds and that people tend to scan rather than read email word for word. Your report needs to deliver value within that eight-second window or risk being deferred indefinitely—which, in practice, often means ignored.
Generic Reports Train Clients to Ignore You
Perhaps the most damaging pattern is when organizations inadvertently train their stakeholders to ignore reports by sending too many low-value communications through the same channel. A discussion on Security StackExchange about writing IT security emails that get read highlights this problem: when you use the same channel for routine newsletters and critical alerts, recipients learn that messages can be safely skipped.
The same principle applies to client reporting. When every weekly update follows the same format, contains similar levels of detail regardless of what's happening, and rarely connects to specific decisions or actions, clients develop a pattern of deferring them. "I'll read that later" becomes "I'll skim it if I have time" and eventually becomes "I'll assume they'll tell me if something is urgent."
What Makes Reports Get Read: The Structural Difference
The good news is that the difference between read and ignored reports follows predictable patterns. Research from project management, email marketing, and stakeholder communication reveals specific structural and content choices that dramatically improve engagement.
Bottom Line Up Front (BLUF) Changes Everything
The single most impactful change you can make to your client reports is adopting the Bottom Line Up Front approach. Project-Management.com's analysis of stakeholder communication emphasizes that the very first thing a stakeholder sees should be a three-second summary of project status and what is needed from them, by when.
This isn't about dumbing down your report—it's about respecting the reality of how busy professionals process information. A stakeholder skimming on their phone during a meeting break should still be able to grasp the critical information and know whether they need to take action.
Databox's client reporting best practices recommend including a TL;DR (Too Long; Didn't Read) summary at the top of reports, summarizing key results and next steps in brief. This approach acknowledges that many recipients won't read the full report but ensures they still get the essential information.
A BLUF structure for a client report might look like:
Status: On track to Q3 revenue goal (+28% vs. target)
Bottom line: Approve revised paid media budget ($15K additional) by Friday to maintain trajectory
Key metric: Conversion rate improved from 2.1% to 3.4%
Risk: Competitor launched similar campaign; monitoring closely
Even if the stakeholder reads nothing else, they know the project status, what's needed, when, and what the key developments are.
Format for Skimming, Not Deep Reading
Accepting that most recipients will skim rather than read allows you to design reports that work with this behavior instead of fighting it. MailUp's formatting guidance emphasizes that long, undivided blocks of text are the primary obstacle to reading. Breaking content into multiple sections and paragraphs, each focused on a specific idea, enables users to skip irrelevant sections and speeds up reading.
Effective formatting for client reports includes:
- Clear headings and subheadings that allow stakeholders to navigate to sections they care about
- Short paragraphs (2-3 sentences maximum) that are comfortable to read on mobile devices
- Sufficient white space so the email doesn't feel overwhelming at first glance
- Strategic bolding of key metrics, deadlines, and action items (but not overused)
- Bullet points for lists and multiple related items
Project-Management.com recommends treating status updates like social media posts—formatted for skimming and mobile reading, with short sections and bold headings that guide the eye to important information.
One Clear Goal Per Report
Reports that try to accomplish too much often accomplish nothing. Simply Stakeholders' email guidance emphasizes that emails without a clear goal or purpose tend to perform poorly, and recommends choosing a simple primary goal and avoiding multiple distinct calls-to-action in one message.
Before sending a client report, you should be able to answer: "What is the one thing I want the recipient to do or know after reading this?" That might be:
- Approve a budget increase by a specific date
- Understand why performance metrics changed this month
- Provide feedback on a strategic direction
- Schedule a meeting to discuss an emerging risk
- Simply stay informed that everything is on track (no action needed)
When a report tries to inform and request approval and solicit feedback and schedule a meeting, the cognitive load increases and recipients often defer the entire message rather than parse out the multiple threads.
Metrics That Actually Matter
One of the fastest ways to train clients to ignore your reports is to fill them with metrics that don't clearly connect to their goals. Databox's guidance is direct: focus on the metrics that demonstrate real progress toward pre-defined goals, and regularly ask whether each metric directly relates to the client's stated goals.
This means being ruthless about cutting vanity metrics. Total website visitors might look impressive, but if the client's goal is lead generation, qualified leads and conversion rates are what matter. Email open rates are interesting, but if the objective is sales, revenue per campaign is the critical metric.
PMI's guidance on status reports recommends that reports be more metric-driven than many project managers currently make them, suggesting that metrics such as schedule variance, budget variance, and risk counts be presented succinctly to provide quantitative grounding for qualitative assessments.
The key is not more metrics but the right metrics, presented with context that explains what they mean and why they matter.
Understanding Email Engagement: What the Data Shows
To improve your client reporting, it helps to understand the baseline of email engagement and what influences whether messages get opened and acted upon.
Open Rates and Subject Line Impact
Mailchimp's extensive email marketing benchmarks show that across all users, average open rates hover around 35.63 percent, with significant variation by industry. Business and finance emails average a 31.35 percent open rate, while non-profits achieve closer to 40.04 percent.
For client reports, this means that even under good conditions, roughly one-third of your reports may never be opened. The difference between the lower and higher ends of this range often comes down to subject line effectiveness.
Simply Stakeholders recommends that subject lines be short—ideally around 41 characters—and that they be personalized, relevant, and curiosity-inducing when appropriate. Personalization, such as including the recipient's name or company, has been shown to increase open rates by roughly 26 percent.
Compare these subject lines:
Generic:
"Monthly Status Update"
Better:
"Acme Corp Q3 Performance: +28% Growth, Budget Approval Needed"
The second version tells the recipient exactly what's inside, signals relevance through personalization, and indicates that action is required—all factors that increase the likelihood of an open.
Click-Through Rates and Content Effectiveness
Getting someone to open your email is only the first hurdle. Campaign Monitor's metrics guide shows that typical click-through rates fall between 2 and 5 percent, meaning that of those who open your email, only a small fraction will click through to detailed dashboards, attached reports, or other linked resources.
The click-to-open rate (CTOR), calculated by dividing unique clicks by unique opens, provides insight into how effective your email content is at motivating action among those who opened it. A low CTOR suggests that while your subject line is working, the email body isn't compelling recipients to engage further.
Mailchimp reports that optimal click-through rates for email campaigns average around 2.66 percent, with a typical range from 1 to 5 percent depending on industry. For client reports, improving this metric often means making your calls-to-action clearer, your linked resources more obviously valuable, and the path to action more frictionless.
The Reality of Skim Reading
The Litmus study on email read time provides sobering context: while 61 percent of emails receive eight seconds or more of attention (classified as "read"), 23 percent are skimmed and 15 percent are merely glanced at. This means that nearly 40 percent of opened emails receive only superficial attention.
For complex client reports, this is particularly challenging. Eight seconds is barely enough time to read a BLUF summary, let alone digest detailed performance analysis. This is why the structural recommendations—BLUF, clear headings, short paragraphs, strategic bolding—are so critical. They allow stakeholders who are skimming to still extract value and identify whether they need to invest more time.
How Modern Email Tools Can Help
While content and structure are paramount, the right email tools can significantly improve both your ability to create effective reports and your clients' ability to process them efficiently.
Unified Inbox Management Reduces Context Switching
One of the most significant barriers to reading client reports is the cognitive overhead of managing multiple email accounts and the context switching required to find and process important messages. Mailbird's Unified Inbox addresses this by allowing users to view emails from multiple accounts in one chronological stream, with system folders like archived, sent, and trash unified across accounts.
For agencies and consultants managing multiple client relationships across different email addresses, this consolidation means that client reports sent to various accounts are all visible in one place, reducing the likelihood that important messages are overlooked simply because they arrived at a non-primary address.
The productivity impact is measurable. Mailbird's productivity research estimates that reduced context-switching through unified inbox management can save 20 to 30 minutes weekly per employee, time that can be redirected toward more thoughtful processing of important communications like client reports.
Email Batching and Focused Processing Windows
Continuous email checking is the enemy of thoughtful report reading. Mailbird's productivity guide recommends establishing three to four designated email processing windows throughout the workday—typically mid-morning, early afternoon, before lunch, and end of business—rather than continuously monitoring the inbox.
This batching approach prevents constant context switching and protects deep work productivity. For client reporting, this means timing your report emails to coincide with common processing windows (mornings are often best) and encouraging clients to adopt similar practices so your reports are reviewed during focused sessions rather than skimmed between meetings.
The guide also recommends disabling email notifications outside processing windows and using snooze functionality to defer non-urgent emails to appropriate times. For recipients, this can transform a "wrong timing" situation into a "focused review" opportunity.
Templates for Consistency and Quality
Creating well-structured client reports every time requires discipline, and templates are one of the most effective ways to ensure consistency. Mailbird Business includes email template functionality that allows you to standardize your report structure.
A well-designed template might include:
- Subject line pattern: "[ClientName] – [Period] Performance: [Status/Key Result]"
- Opening BLUF summary section with status, key metrics, and bottom-line requirements
- Structured sections with clear headings: "Performance vs. Goal," "Key Insights," "Risks & Mitigation," "Recommended Actions"
- Short paragraph placeholders that enforce brevity
- Call-to-action section with clear next steps and deadlines
- Link to detailed dashboard or supplementary materials
Mailbird's research suggests that template use can save 10 to 15 minutes weekly per employee by reducing repetitive composition work and ensuring that important elements are included by default.
Read Receipts and Follow-Up Intelligence
One of the challenges with client reporting is knowing whether your message has been received and reviewed. Mailbird's read receipt functionality provides visibility into when messages have been opened, capturing only the time and name associated with the open without collecting additional sensitive data.
This feature allows you to:
- Confirm that critical reports have been received and opened
- Determine appropriate timing for follow-up communications
- Identify patterns in when specific clients engage with reports
- Distinguish between "not opened" and "opened but no response" scenarios
When a critical quarterly performance report shows no opens within a reasonable timeframe, you can proactively follow up to ensure it's seen. Conversely, if read receipts indicate the report was opened but no response follows, you might send a shorter, more targeted email emphasizing specific decisions needed.
Used ethically and transparently—preferably with clients aware that read receipts may be used on important communications—this capability helps ensure that client reports don't silently disappear.
Priority Management and Categorization
Mailbird's recommended workflow includes organizing emails into categories such as "Action Required," "Waiting For," "Reference," and "Quick Reply." For both senders and recipients of client reports, this categorization system supports more deliberate handling.
As a report sender, you can categorize client communications as "Waiting For" after sending a report that requires client response, using read receipts to track which messages are awaiting replies from recipients who have already opened them. This creates a systematic follow-up process rather than relying on memory.
For report recipients, categorizing incoming client reports as "Action Required" when they contain decisions, "Waiting For" when they represent updates from the agency, or "Reference" when they're informational ensures that such messages aren't lost among low-priority communications.
Putting It All Together: A Practical Framework
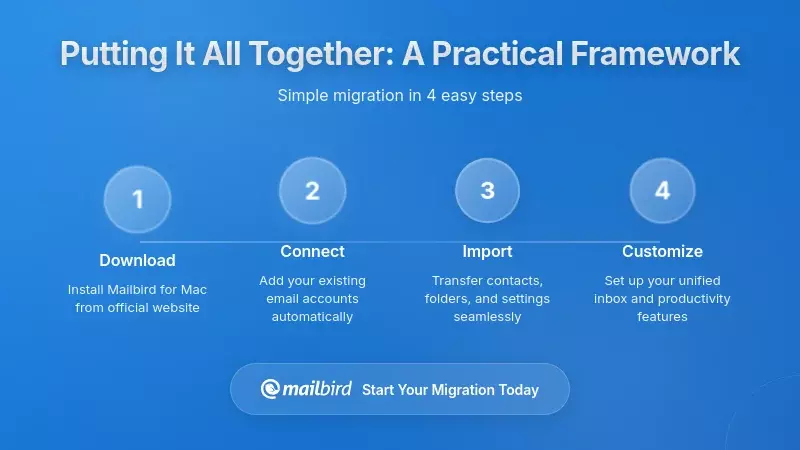
Understanding what makes reports readable is valuable, but implementation is where the real impact happens. Here's a practical framework for creating client reports that get read and drive action.
Step 1: Set Clear Expectations From Day One
Databox emphasizes that effective client reporting begins at the outset of the relationship, with clear expectations and measurable goals defined from day one. This means having explicit conversations about:
- What specific, measurable goals the engagement is targeting
- Which KPIs will be used to track progress
- How often reports will be sent (weekly, monthly, quarterly)
- What format reports will take (email summary with dashboard link, detailed PDF, live dashboard access)
- What level of detail the client wants
- What decisions or actions the client expects reports to support
This upfront alignment ensures that your reports are designed around client needs rather than your documentation preferences, significantly increasing the likelihood of engagement.
Step 2: Design Your Report Template
Create a standardized template that incorporates all the structural best practices:
Subject Line Template:
[ClientName] – [Period] [Report Type]: [Status] – [Key Highlight]
Example: "Acme Corp – October Performance: On Track – Conversion Rate +45%"
Email Body Template:
SUMMARY (BLUF)
Status: [On Track / At Risk / Off Track]
Key Result: [Most important metric or outcome]
Action Needed: [What you need from client, by when]
Risk Alert: [Any significant concerns or changes]
PERFORMANCE VS. GOAL
[2-3 key metrics with brief context]
• Metric 1: [Number] ([vs. target], [vs. last period])
• Metric 2: [Number] ([vs. target], [vs. last period])
• Metric 3: [Number] ([vs. target], [vs. last period])
KEY INSIGHTS
[2-3 short paragraphs explaining what changed and why it matters]
RECOMMENDED ACTIONS
[Specific next steps with owners and deadlines]
1. [Action] – [Owner] – [Deadline]
2. [Action] – [Owner] – [Deadline]
DETAILED DASHBOARD
[Link to full analytics dashboard for those wanting more detail]
Step 3: Focus on Goal-Aligned Metrics
For each reporting period, ruthlessly evaluate whether each metric in your report directly demonstrates progress toward the client's stated goals. Databox's guidance is to regularly ask: "Does this metric directly relate to the client's goals, or could the same insights be conveyed more clearly with a different metric?"
Replace vanity metrics with meaningful ones:
- Instead of "Total Website Visitors," use "Qualified Leads from Target Industries"
- Instead of "Email Sends," use "Revenue per Campaign"
- Instead of "Social Media Impressions," use "Engagement Rate from Target Audience"
- Instead of "Page Views," use "Conversion Rate on Key Landing Pages"
Step 4: Tell the Story, Not Just the Numbers
Databox recommends not simply showing clients that a metric changed but explaining what changed and why it matters to their strategy. Tie data back to specific actions taken, such as new keyword strategies, refreshed content, or campaign adjustments.
Instead of: "Organic traffic increased 28%"
Write: "Organic traffic increased 28% following the content refresh we implemented in September. The three new industry guides are now ranking in the top 5 for target keywords, driving qualified traffic from decision-makers in your target accounts. Conversion rate from this organic traffic is 3.2%, above the 2.1% site average, suggesting strong content-market fit."
This narrative approach helps clients understand not just what happened, but why it happened and what it means for their business.
Step 5: Maintain Transparency and Trust
Databox emphasizes that agencies must "always share the full picture, even when the data isn't favorable," warning that cherry-picking positive metrics or obscuring underperformance erodes trust and leads to skepticism about future reports.
When metrics underperform, acknowledge it directly and explain:
- What contributed to the underperformance
- What you've learned from it
- What specific actions you're taking to address it
- What you need from the client to improve outcomes
Clients are more likely to engage with reports that feel honest and objective than those that feel like marketing materials.
Step 6: Optimize Delivery Timing and Cadence
Rather than defaulting to weekly or monthly reporting, align your cadence with client needs and decision cycles. PMI notes that frequency, level of detail, and delivery method should depend on where stakeholders fit into the project team and the information they require.
Consider a hybrid approach:
- Maintain a live dashboard that clients can access anytime
- Send brief weekly email summaries highlighting key changes and action items
- Provide more detailed monthly reports for strategic review
- Schedule quarterly business reviews for in-depth discussion
Time your email reports to arrive during common processing windows (mid-morning is often effective) and avoid sending them late on Fridays or during known vacation periods.
Step 7: Measure and Iterate
Use email engagement metrics to continuously improve your reports. Track:
- Open rates by client and subject line pattern
- Click-through rates to dashboards and detailed reports
- Time from report send to client response
- Read receipt data on when reports are opened
- Client feedback on report usefulness
If open rates are low, experiment with subject line personalization and clarity. If click-through rates are poor, evaluate whether your calls-to-action are compelling and whether linked resources are valuable. If clients consistently respond days later, consider whether your reporting cadence matches their decision cycles.
Common Mistakes That Guarantee Your Reports Get Ignored
Understanding what not to do is as important as knowing best practices. Project-Management.com identifies several patterns that reliably lead to ignored reports.
Making Reports Too Long
The most common mistake is treating email reports like comprehensive documentation. Stakeholders don't have time to read multi-page status updates, especially on mobile devices. If your email report requires scrolling through multiple screens to find the key information, it's too long.
The solution isn't to remove important information—it's to layer it. Put the essential summary in the email body and link to detailed dashboards, appendices, or supplementary documents for those who want to dig deeper.
Burying the Lead
Reports that begin with background context, methodology explanations, or chronological activity logs before getting to the actual status and implications violate the BLUF principle and lose readers immediately.
If a stakeholder has to read three paragraphs before understanding whether the project is on track and what's needed from them, the report is structured backward.
Using Generic Subject Lines
Subject lines like "Status Update," "Monthly Report," or "Project Progress" provide no information about content or urgency. They blend into the background of inbox noise and give recipients no reason to prioritize opening them.
Specific, personalized subject lines that signal value or urgency perform dramatically better: "Q3 Campaign Performance: 45% Above Target, Budget Decision Needed by Friday."
Reporting Activity Instead of Outcomes
PMI emphasizes that status reports should focus on whether projects are on-target, off-target but recoverable, or off-target and not recoverable, along with solutions and actions taken, rather than cataloging week-to-week activities.
Stakeholders don't need to know that you had three meetings, updated five documents, and sent two proposals. They need to know whether you're on track to hit the goal, what risks exist, and what decisions they need to make.
Sending Reports Without Clear Calls-to-Action
Reports that end with "Let me know if you have questions" or "Please review and provide feedback" are too vague. Simply Stakeholders notes that emails without clear goals or with multiple competing calls-to-action often produce poor results because recipients don't know what to focus on.
Specific calls-to-action get better responses: "Please approve the revised budget by Friday, October 25th so we can proceed with the campaign launch on November 1st."
Over-Communicating with Low-Value Updates
Sending reports too frequently, especially when there's little new information to share, trains clients to ignore them. The Security StackExchange discussion highlights that using the same channel for routine newsletters and critical information teaches recipients that messages can be safely skipped.
If your weekly reports consistently say "everything is on track, no changes," consider moving to a bi-weekly or monthly cadence and only sending interim updates when something significant changes.
Frequently Asked Questions
How often should I send client reports?
According to Databox's client reporting best practices, there is no one-size-fits-all reporting cadence. The optimal frequency depends on client needs, project complexity, and decision cycles. Many agencies default to weekly or monthly reports, but the research emphasizes asking clients directly about their preferences. Some clients may prefer brief weekly summaries with access to live dashboards, while others want less frequent but more comprehensive monthly reviews. The key is aligning reporting cadence with when clients actually need information to make decisions, rather than following an arbitrary schedule. PMI notes that frequency should depend on where stakeholders fit into the project team and the information they require. Consider implementing a hybrid approach: maintain a live dashboard for continuous access, send brief weekly highlights only when significant changes occur, and provide detailed monthly strategic reviews.
What's the ideal length for a client report email?
Mailbird's email productivity research recommends keeping individual emails concise—typically three sentences or less for optimal engagement—paired with clear, action-oriented subject lines. For client reports specifically, the research from Project-Management.com emphasizes that reports should be formatted for mobile skimming, with short paragraphs and sufficient white space. The ideal structure is a brief email body containing a BLUF summary, key metrics, and essential insights that can be consumed in under two minutes, with links to detailed dashboards or supplementary documents for stakeholders who want deeper analysis. Litmus research shows that 61 percent of emails receive eight seconds or more of attention, meaning your core message needs to be extractable within that timeframe. Think of the email as an executive summary with links to full documentation, not as the documentation itself.
Should I use read receipts on client reports?
Mailbird's read receipt functionality can be valuable for client reporting when used appropriately and transparently. The feature captures only the time and name associated with email opens without collecting additional sensitive data, providing useful engagement intelligence. Read receipts help you confirm that critical reports have been received and opened, determine appropriate timing for follow-up communications, and distinguish between "not opened" and "opened but no response" scenarios. However, the research emphasizes using this capability ethically and transparently—preferably with clients aware that read receipts may be used on important communications. The benefit is particularly strong for time-sensitive reports requiring decisions or approvals, where knowing whether a client has seen the information can inform your follow-up strategy. If a critical quarterly report shows no opens within a reasonable timeframe, you can proactively follow up via alternative channels to ensure it's seen, whereas if opens are recorded but no response follows, you might send a shorter, more targeted email emphasizing specific decisions needed.
How do I get clients to actually read my reports instead of just skimming them?
The research from Campaign Monitor and Litmus shows that most recipients will skim rather than deeply read emails—approximately 23 percent of opened emails are skimmed and 15 percent are merely glanced at. Rather than fighting this behavior, design reports that work with it. Implement the Bottom Line Up Front (BLUF) approach recommended by Project-Management.com, placing a three-second summary of status and required actions at the very top. Use clear headings, short paragraphs, strategic bolding of key metrics and deadlines, and sufficient white space to make the report scannable on mobile devices. MailUp's formatting guidance emphasizes breaking content into multiple sections with headings, managing spacing to give text breathing room, and using bold sparingly to highlight critical information. The goal isn't to force deep reading but to ensure that even a quick skim extracts the essential information and signals whether deeper engagement is needed.
What metrics should I include in client reports?
Databox's client reporting guidance emphasizes focusing exclusively on metrics that demonstrate real progress toward pre-defined client goals. The research recommends regularly asking whether each metric directly relates to the client's stated goals or whether the same insights could be conveyed more clearly with a different metric. Rather than including every available data point, be ruthlessly selective: if the client's goal is lead generation, focus on qualified leads, conversion rates, and cost per acquisition rather than total website visitors or page views. PMI recommends that reports be more metric-driven than many currently are, suggesting metrics such as schedule variance, budget variance, and risk counts be presented succinctly to provide quantitative grounding. The key principle is goal alignment: every metric should clearly connect to a specific client objective, with context explaining what the number means and why it matters. Replace vanity metrics with meaningful ones, and when in doubt, ask clients which metrics they find most valuable for their decision-making.
How can I make my report subject lines more effective?
Simply Stakeholders' research shows that subject lines should be short—ideally around 41 characters—and personalized, with personalization such as including the recipient's name or company increasing open rates by roughly 26 percent. Mailchimp's email marketing benchmarks indicate that average open rates hover around 35.63 percent, with significant variation based on subject line effectiveness. For client reports, the research emphasizes that subject lines should be relevant, highlight value, and clearly signal what's inside rather than using generic labels. Instead of "Monthly Status Update," use specific, value-signaling formats like "[ClientName] – [Period] Performance: [Status] – [Key Highlight]." For example: "Acme Corp – October Performance: On Track – Conversion Rate +45%" immediately tells the recipient who the report is for, what period it covers, the overall status, and the most significant result. This specificity and personalization dramatically increases the likelihood of opens compared to vague, generic subject lines that blend into inbox noise.
Should I send reports as email attachments or in the email body?
The research consistently recommends putting essential information in the email body rather than requiring recipients to download attachments. Project-Management.com's analysis emphasizes that stakeholders increasingly consume information on mobile devices where opening attachments creates friction and reduces engagement. Campaign Monitor notes that approximately 63 percent of emails are now opened on mobile devices, making responsive, mobile-optimized email body content essential. The recommended approach is to include a BLUF summary, key metrics, and essential insights directly in the email body, formatted for easy mobile reading with short paragraphs and clear headings, and then provide a link to a detailed dashboard or comprehensive report for stakeholders who want deeper analysis. This layered approach respects the reality that many recipients will only read the email summary while still providing access to full documentation for those who need it. Databox recommends including a TL;DR summary at the top of reports or in the delivery email to help busy clients quickly understand essence without wading through detailed metrics.
How do I handle underperforming metrics in client reports?
Databox's guidance is direct: agencies must always share the full picture, even when data isn't favorable, because cherry-picking positive metrics or obscuring underperformance erodes trust and leads to skepticism about future reports. When metrics underperform, the research recommends acknowledging it directly and explaining what contributed to the underperformance, what you've learned from it, what specific actions you're taking to address it, and what you need from the client to improve outcomes. PMI emphasizes that status reports should clearly state whether projects are on-target, off-target but recoverable, or off-target and not recoverable, along with solutions and actions already taken. Transparency builds trust over time and positions you as a strategic partner rather than a vendor trying to hide problems. Clients are more likely to engage with reports that feel honest and objective than those that feel like marketing materials, and addressing challenges proactively demonstrates expertise and accountability rather than weakness.


